Clear Vibrations

Quakertown, PA's Mobile Enhancement Headquarters

550 California Road Suite 7
Quakertown, PA 18951
267-227-3875
  • Home
  • Services
    • Car Audio
    • Custom Installation
    • Driver Safety
    • Fleet Services
    • Remote Car Starters
  • About Us
    • Work for Clear Vibrations
  • Reviews
  • Location
  • Contact Us
  • Facebook
  • Instagram
  • Twitter
  • YouTube

Product Spotlight: Thinkware U1000 Plus Dash Camera

Thinkware U1000 Plus

If you are shopping for a premium dash camera with a high-resolution image sensor, the Thinkware U1000 Plus should be on your shortlist. This solution can record video in 4K resolution and is available with a secondary camera to capture what happens behind your vehicle. Let’s take a close look.

Design of the Thinkware U1000 Plus Dash Camera

The U1000 Plus is a low-profile camera that mounts at the top of your windshield. Rather than a square or round body, the bulk of the camera sits flat against the glass. This design leaves a lot of clearance for the sun visor and rearview mirror.

The main camera can be tilted up or down to ensure the system works with windshields with varying rakes. The camera body is 4.33 inches tall, 2.55 inches wide and 1.18 inches thick. On the left side of the chassis are power connections, a port for an external radar sensor and the optional rear camera. The rear camera uses a USB connection, so you shouldn’t have issues with RF interference. Thinkware includes a hardwire installation kit with the camera. You can upgrade to the OBD-II power cable if you don’t want any of the wiring in your vehicle modified. This is a wise investment for leased vehicles.

Thinkware U1000 Plus
The right side of the chassis has the Micro SD memory card slot, the reset button and the microphone.

Once installed, the camera body has the manual recording button in the center and the Power, Wi-Fi and voice recording buttons in the upper left corner. LEDs across the top indicate when the unit is on, when Wi-Fi is enabled, and when the GPS receiver has locked on enough satellites to pinpoint your location.

Thinkware U1000 Plus

Thinkware Dash Camera Specifications

This camera features a Sony IMX515 STARVIS-Series image sensor that can record at up to 3840 x 2160 pixels at 30 frames per second. It can also be configured to record in 2K mode at 2560 x 1440 pixels at 60 frames per second. The viewing angle is rated at 135.6 degrees, offering a good balance of detail and field of vision.

The rear camera features a Full HD-quality image sensor that records 1920×1080 pixels at 30 frames per second. Both the front and rear cameras have a High Dynamic Range (HDR) mode that compresses the light and dark parts of the image to make objects in shadows, or that might be washed out by a bright light source more visible. Low-light performance is further enhanced with Thinkware’s Super Night Vision 3.0. This processing reduces noise when light levels are low to keep videos clear and sharp.

Thinkware U1000 Plus
The Wide Dynamic Range mode compresses bright areas and brightens dark parts of the image to make everything more visible.

Video files are stored using the HEVC format H.265 to maximize file storage. With the 64GB card included, the system can store up to 151 minutes of video in a dual-camera solution. You can increase the size of the memory card to 512 GB for an incredible 1229 minutes of storage.

You can upgrade the U1000 Plus to a five-camera system using Thinkware’s optional multiplexer and three additional cameras. This is an ideal solution for taxi, limousine and rideshare applications.

Thinkware U1000 Plus
The U1000 Plus can be upgraded with the optional multiplexer module and additional cameras for better coverage.

Parking Mode Protection

The Thinkware U1000 Plus includes several parking mode options. In energy-saving mode, the camera only stores video when the onboard accelerometer detects impacts. Motion and Impact mode allows the camera to watch for vehicles or people entering the field of vision along with impact sensing. The camera stores a 20-second video that starts 10 seconds before the event trigger. Time Lapse mode records constantly at two frames per second.

The U1000 Plus can be upgraded with Thinkware’s optional radar module. Rather than monitoring the area in front of the vehicle using the image sensor, the radar sensor detects someone or something approaching. This dramatically reduces current consumption, so there is less draw on the vehicle battery.

Thinkware U1000 Plus
The optional radar sensors can dramatically reduce current draw when using parking mode.

Wi-Fi Connectivity

You can use the Thinkware Dashcam Link app on your Android smartphone, iPhone, or tablet to view video files stored on the system. Once connected, your installer can adjust the system settings and fine-tune the viewing angle to ensure maximum coverage.

The Thinkware Connected app gives the U1000 Plus Cloud-based connectivity. If you have a mobile hotspot, or the dashcam can connect to Wi-Fi at your home, you can view what the camera sees on your phone. You’ll also get impact notifications when parked. The vehicle operator can send an emergency message to the registered contact by pressing the REC button on the chassis for three seconds. Parents or business owners can review the vehicle’s operational history to review use and driving behavior.

Advanced Driver Assistance Systems

Modern video processing technology allows the U1000 Plus to warn the operating. These Advanced Driver Assistance Systems (ADAS) include Front Vehicle Departure Warnings (FVDW), Forward Collision Warnings (FCWS) and Lane Departure Warnings (LDWS). Notifications about approaching a vehicle too quickly or crossing the lines on the side of the road can help prevent serious accidents.

Thinkware U1000 Plus
ADAS features like Forward Collision Warning integrated with the Thinkware U1000 Plus can help prevent serious accidents.

If you are shopping for a premium dash camera with a high-resolution image sensor, the Thinkware U1000 Plus should be on your shortlist. This solution can record video in 4K resolution and is available with a secondary camera to capture what happens behind your vehicle. Let’s take a close look.

Upgrade Your Vehicle with a Thinkware Dash Camera

We all know that having a dash camera is the best way to protect yourself from fraud and false accusations. It’s also an ideal solution for capturing those “I can’t believe that just happened” moments. When upgrading your vehicle, drop by a local authorized Thinkware retailer and ask about the U1000 Plus system. They can provide you with a quote that includes expert installation.

You can learn more about Thinkware products like the U1000 Plus by visiting their website. Their dealer locator makes it easy to find a retailer near you to help design and install a premium dash camera system.

This article is written and produced by the team at www.BestCarAudio.com. Reproduction or use of any kind is prohibited without the express written permission of 1sixty8 media.

Filed Under: ARTICLES, Driver Safety, PRODUCTS, RESOURCE LIBRARY Tagged With: Thinkware

Why Do Speakers and Subwoofers Sometimes Have CCAW Voice Coils?

CCAW Voice Coil

You should be aware that copper-clad aluminum wire is the least-preferred option for connecting an amplifier to your vehicle’s battery or alternator. Copper-clad aluminum wire has more resistance for a given diameter than an all-copper cable. As a result, it wastes precious voltage and transforms it into heat when it could be allowing your amplifier to make more power. Why do many high-quality speakers and subwoofers use CCAW in their voice coils? Read on for an explanation.

Speaker Parameters and Frequency Response

No single specification can describe how a speaker or subwoofer will perform. To create a product that delivers flat response through its designed operating range, speaker design engineers need to balance several factors to achieve their design goals. These factors include the speaker’s size, resonant frequency, cone mass, suspension compliance, inductive properties and target power-handling capabilities.

CCAW Voice Coil
A comparison of a speaker with 5 grams added and subtracted from the cone assembly.

The graph above shows the predicted frequency response of a Rockford Fosgate T4652S woofer in red. The low-frequency response and efficiency are based primarily on the driver’s suspension compliance and the cone’s mass. The speaker’s voice coil inductance is what determines the high-frequency roll-off.

The yellow trace is the same driver, with 5 grams added to the moving mass value. As you can see, the driver is a few decibels louder at frequencies below 80 Hz and a few decibels less efficient above that frequency. The decrease in efficiency happens because the assembly is more challenging to accelerate. A second change is that the resonant frequency is lower.

The green trace is the same Rockford Fosgate driver simulation with 5 grams subtracted from the moving mass. As expected, the driver would produce less bass but be more efficient at higher frequencies.

Speaker engineers work hard to balance all these criteria to produce a product that will blend well with your subwoofers and offer good efficiency. If we take a given speaker design and add mass to the cone assembly, we increase how much bass it can produce but decrease its efficiency. Likewise, reducing the mass results in an increase in the speaker’s efficiency and a reduction in bass output.

Voice Coil Impedance Matters

Another factor that’s crucial to speaker design is voice coil impedance. When an engineer sets out to create a speaker, one of the target specifications will be for the driver to have a specific nominal impedance. Designing a speaker with a 2-ohm impedance doesn’t work if it’s intended for use with an amplifier designed for 4-ohm loads.

Speaker designers have different options for voice coil wire diameter to change the impedance of the winding. More wire means more impedance. Smaller diameter wire also increases the impedance.

However, they must create a voice coil winding tall enough to ensure that the driver remains linear at its excursion limits. The voice coil winding must also be tall enough to handle the heat it will dissipate. Dainty, small-diameter windings, like you’d find in entry-level speakers, don’t have enough physical size to dissipate large amounts of heat. When they get hot, the varnish on the wire melts, and the windings may short together or unravel. The result is a permanently damaged woofer. As such, larger-diameter windings, which use more wire, are necessary.

Another way to increase thermal power handling is to add additional layers to the voice coil. You may have seen four- and six-layer voice coils in some high-power subwoofers. These designs can handle more power than a two-layer coil. However, more copper means more resistance and more mass. The result of these mass increases is decreased speaker efficiency.

CCAW Voice Coil
An example of a speaker voice coil that has melted because of too much power. Image Credit: Elliot Sound Products

The Benefits of CCAW Voice Coils

Speaker design engineers often turn to CCAW to add resistance to a voice coil winding. For example, we might want a speaker to have a nominal impedance of 4 ohms. As such, the voice coil will require a specific amount of copper wire to hit that impedance. The designer could also use 1.62 times as much CCAW of the same diameter wire to reach the same impedance. We also want the voice coil assembly to hit a target mass to work with the cone, dust cap, spiders and surround to achieve a target mass. The choice of material for the voice coil former is also a variable.

CCAW has less mass per unit length than all-copper conductors. It also has more resistance per unit length.

Let’s look at the mass of a CCAW conductor that is 25% copper and 75% aluminum. First, we know copper has a specific gravity of 8.96. Aluminum has a specific gravity of 2.7. If we combine these in a ratio of three parts aluminum to one part copper, we have an alloy with a specific gravity of 4.265. That’s just under half the specific gravity of copper alone. For the sake of simplicity, you can generalize that CCAW weighs half as much as copper. The actual mass depends on the ratio of copper to aluminum, which varies significantly from each supplier.

Next, let’s look at resistance the same way. For a given area, copper has a resistance of 1.7×10⁻⁶ ohms per centimeter. Aluminum’s resistance is 2.7×10⁻⁶ ohms per centimeter. Most CCAW wiring offers 0.62 to 0.64 of the conductivity of pure copper.

So, a speaker designer can increase the length of the conductor in a voice coil using CCAW wire to hit a target size and impedance. They can switch to CCAW wire to decrease the mass of a voice coil assembly.

CCAW Voice Coil
A selection of four-layer subwoofer voice coils.

There’s No Correlation Between Amplifier Wiring and Voice Coil Design

So the next time you hear someone put down a speaker design because it features a CCAW voice coil, remind them that speaker design and power delivery goals are unrelated. When powering an amplifier, we want the lowest resistance wires possible. We want the lowest resistance wires possible when connecting a speaker or subwoofer to an amplifier. As such, we should use large-gauge, all-copper wiring. When it comes to speaker design, the goals are very different. The engineer wants a voice coil with a specific length, impedance and mass. A conductor with more resistance and less mass per unit length is one of the variables the designer can change to meet their goals.

This article is written and produced by the team at www.BestCarAudio.com. Reproduction or use of any kind is prohibited without the express written permission of 1sixty8 media.

Filed Under: ARTICLES, Car Audio, RESOURCE LIBRARY

What Happens When Using an Oversize Subwoofer Enclosure?

Oversize Subwoofer Enclosure

What happens when a subwoofer is used with an oversized subwoofer enclosure? This article will look at the good, the bad and the ugly in terms of an improper match between the electromechanical characteristics of a subwoofer and the need for a proper enclosure.

Why Do Subwoofers Need an Enclosure?

If you’ve been following our series of articles on understanding subwoofer quality, then you’ll know that the purpose of a subwoofer enclosure is to act as a mechanical high-pass filter. That’s right: The enclosure limits how much low-frequency information a subwoofer produces. Why? Well, below about 250 or 300 Hz, a speaker cone has to move four times as much for every octave lower it plays. Put another way, if you have a subwoofer playing a 100-Hz tone and it’s moving 0.25 mm, it needs to move 1 mm to produce the same output at 50 Hz, and 4 mm to produce the same result at 25 Hz. It would theoretically have to move 16 mm to make the same output at 12.5 Hz.

Why is cone excursion a problem? Well, the suspension components (surround and spider), along with the length of the voice coil and thickness of the top plate, determine how far the cone can move linearly. Linearity is vital because distortion skyrockets when things get non-linear. Think of this like mechanical clipping. It can sound just as bad as an amplifier that’s clipping. In extreme cases, mechanical components of a speaker crash into each other, which can cause damage.

If you’ve ever analyzed the frequency content of popular music, you’ll know that most of it has very little audio information below 35 Hz. The chart below shows the frequency content of several songs. The trace in red is “Dance the Night” by Dua Lipa. The orange trace is “Industry Baby” by Lil Nas X feat. Jack Harlow. The yellow trace is “Paint the Town Red” by Doja Kat. “Slime You Out” by Drake is in green. “Clocks” by Coldplay is in blue. Finally, the violet trace is “I’m Shady” by Eminem. There is nothing below 35 Hz of significance in any of these tracks. That’s not to say that some music doesn’t contain significant amounts of deep bass and even infrasonic information – it’s just less common than you think.

Oversize Subwoofer Enclosure
The average spectral content of modern music.

If we can control how much the speaker cone moves at very low frequencies, we can apply a lot of power to a speaker around and above 35 Hz so it will play loudly while preventing the speaker from bottoming out. An infrasonic filter, often mistakenly called a subsonic filter, does the same thing. The electrical filter has one huge benefit: It eases the load on the amplifier, the vehicle’s electrical system and the thermal power handling requirements of the subwoofer.

A Quick Comparison of Acoustic Suspension and Bass Reflex Subwoofer Systems

Two popular types of subwoofer enclosures are used in car audio systems: acoustic suspension (sealed) and bass reflex (vented or ported) designs. An acoustic suspension enclosure is a simple sealed cabinet. The math that predicts the frequency response and excursion of the subwoofer is relatively simple, and the performance is predictable. Notably, there’s no significant change in performance if the volume of an acoustic suspension enclosure varies slightly from the specifications. A bass reflex enclosure is typically larger and includes a vent (or port) of a specific area and length to create a resonating system. At its resonant frequency, most of the sound from the enclosure comes from the vent, and the subwoofer cone moves very little. This is why using a large enough vent with proper radii on both ends is crucial.

Oversize Subwoofer Enclosure
Cone excursion simulations of a 12-inch woofer in common sealed and vented enclosures.

The traces in the above image are very typical in terms of this comparison of sealed and vented enclosures. The red trace is the sealed enclosure with a net volume of 1.02 cubic feet. We can see that the low-frequency cone excursion plateaus below 50 Hz. Why? The compliance of the air inside the enclosure adds to the compliance of the subwoofer’s suspension to limit motion. In short, the suspension becomes stiffer.

The yellow trace represents a vented enclosure with a net volume of 1.79 cubic feet and a vent tuned to 40 Hz. Around 60 Hz, the cone excursion on the vented enclosure is slightly higher. This increase happens because the enclosure is larger. Around the tuning frequency of 40 Hz, the woofer cone barely moves. The graph below shows the velocity of the column of air in the vent at the same 400-watt drive level.

Oversize Subwoofer Enclosure
Vent air velocity for our 1.79-cubic-foot enclosure tuned to 40 Hz.

The yellow trace shows us that the vent’s air column moves the most at 40 Hz. This makes sense, as this small area produces most of the sound from the enclosure at this frequency.

How Acoustic Suspension Enclosure Volume Affects Response and Excursion

Let’s start looking at how changes in enclosure volume affect frequency response and cone excursion. Considering both of these criteria is crucial since the enclosure’s purpose is to prevent our subwoofer from bottoming out.

Let’s use a roughly 25% variance in enclosure volumes so that the differences in performance are clearly visible. All drivers can work within a range of volumes, so 10% either way just isn’t going to make a huge difference.

Oversize Subwoofer Enclosure
A predicted frequency response comparison in four sealed subwoofer enclosure volumes.

In the graph above, I’ve modeled the predicted response of a Rockford Fosgate Punch P2D2-12 subwoofer, which is in the BestCarAudio.com lab for an upcoming Test Drive Review. The red trace is our 1.02-cubic-foot enclosure that matches the acoustic suspension enclosure suggestion on the Rockford Fosgate website. The green trace is a 0.75-cubic-foot enclosure. As expected, using this enclosure reduces output below 65 Hz and increases the resonant peak up to around 80 Hz. Going the other way, we have a 1.25-cubic-foot enclosure in light green and a 1.5-cubic-foot enclosure in orange. The increase in low-frequency output below 65 Hz isn’t significant, which tells us the driver’s suspension plays a more substantial role in cone control.

Regarding outright “accuracy,” the larger enclosures have a lower total system Q. This value is called the Qtc. Lower Qtc values correlate to less resonance and, consequently, tighter sound. The 0.75-cubic-foot enclosure has a Qtc of 0.976, which is considered high. The “optimized” 1.02-cubic-foot enclosure has a Qtc of 0.881, which is still on the high side but gives us a good upper bass kick with some added efficiency. The 1.25- and 1.5-cubic-foot enclosures have Qtc values of 0.826 and 0.781. Many consider a Qtc of 0.707 to be the ideal Q-factor. In reality, it’s a good balance of efficiency and damping. The ideal Qtc is 0.5, but an enclosure with enough volume to produce that value can result in excursion issues. The Qts value of this subwoofer is 0.52, so it’s impossible to get a Qtc value lower than that.

Speaking of excursion, let’s look at a comparison of cone excursion versus frequency for our four sealed enclosures.

Oversize Subwoofer Enclosure
A prediction of cone excursion at 400 watts in different enclosure volumes.

As expected, the larger enclosures allow the woofer cone to move more at lower frequencies. Fortunately, this subwoofer has an Xmax specification of 13.3 mm, so we don’t run into any issues at any frequency at this power level.

Let’s look at an extreme comparison of sealed enclosure volumes.

Oversize Subwoofer Enclosure
The violet trace represents the predicted frequency response of the P2D2-12 in a 3.0-cubic-foot enclosure.

The graphs above show the 1.02-cubic-foot enclosure predicted response in red and the subwoofer’s response in a 3.0-cubic-foot enclosure in violet. Larger enclosures mean more output at lower frequencies. This massive enclosure produces 3.3 dB more output at 30 Hz. That’s not a huge gain, but it represents an increase similar to what you’d hear if you could provide the subwoofer with twice as much power.

We do run into a problem, though. At frequencies below 20 Hz, the driver will exceed its 13.3-millimeter Xmax specification. A nice shallow -6 dB/octave infrasonic filter set to 20 Hz would protect this driver from damage should your music contain audio below 20 Hz. Your installer would have to use a DSP to configure an infrasonic filter like this.

Oversize Subwoofer Enclosure
A comparison of cone excursions in enclosures of 1.02 cubic feet (red) and 3.0 cubic feet (violet).

Bass Reflex Enclosure Volume Comparisons

Let’s look at bass reflex enclosures with the same Rockford Fosgate P2D2-12 driver. We’ll start with the 1.79-cubic-foot suggested enclosure as our reference, then go up and down by 25% while maintaining the same 40-hertz tuning frequency.

Oversize Subwoofer Enclosure
A comparison of four vented enclosure volumes with 40-Hz tuning.

In the chart above, the yellow trace is our reference 1.79-cubic-foot enclosure tuned to 40 Hz. The green trace represents an enclosure volume of 1.35 cubic feet, the light green trace is 2.24 cubic feet, and the orange is 2.68 cubic feet. The results show that the system’s peak output frequency moves closer to the tuning frequency as volume increases. Let’s look at the vent air velocity graph to see if it corroborates this hypothesis.

Oversize Subwoofer Enclosure
Predicted vent air velocity for different enclosure volumes.

The maximum vent air velocity frequency moves closer to 40 Hz as the enclosure volume increases. It’s worth noting that the 4-inch diameter vent isn’t suitable for the largest volume enclosure as the velocity exceeds 34.5 meters per second. The vent must be larger and subsequently longer to function correctly with this enclosure volume. Analyzing vent air velocity is another crucial part of subwoofer enclosure design.

Oversize Subwoofer Enclosure
A comparison of predicted cone excursion in different enclosure volumes.

It should be no surprise that the larger enclosures provide less control over woofer cone excursion. Fortunately, the high tuning frequency controls cone motion around 50 to 60 Hz. Below the tuning frequency, we need an infrasonic filter set to 27 Hz for the largest enclosure to keep things under control at this power level.

Effects of Tuning Frequency on Output and Cone Excursion

We put woofers in larger enclosures to get them to play louder at lower frequencies. Let’s look at what happens if we change the tuning frequency of our reference 1.79-cubic-foot enclosure.

Oversize Subwoofer Enclosure
A comparison of four 1.79-cubic-foot enclosures tuned to different frequencies.

The chart above shows our reference enclosure of 1.79 cubic feet tuned to 40 Hz in yellow. The green trace is the same volume tuned to 45 Hz. The light green trace shows the enclosures’ predicted response when tuned to 35 Hz. The orange trace represents a tuning frequency of 30 Hz. There are no surprises here as we trade upper bass output for more output at lower frequencies.

Oversize Subwoofer Enclosure
A comparison of four tuning frequencies for our 1.79-cubic-foot enclosure.

Once again, there are no surprises shown here. The dip in cone excursion aligns with the different tuning frequencies. We don’t have any excursion problems above the tuning, and an infrasonic filter will keep things safe at lower frequencies.

What happens if we combine smaller and larger enclosure volumes with different tuning frequencies? In this example, with the Rockford Fosgate subwoofer, things work out. But that’s not always the case.

Oversize Subwoofer Enclosure
Predicted output of four enclosure volumes tuned to different frequencies.

In the graph above, the yellow trace is our 1.79-cubic-foot enclosure tuned to 40 Hz. The green trace is 1.35 cubic feet tuned to 45 Hz. The light green trace is 2.24 cubic feet tuned to 35 Hz. Finally, the orange trace is 2.68 cubic feet tuned to 30 Hz.

Knowing that larger enclosure volumes focus the subwoofer system output around the tuning frequency, we should be able to get even deeper bass if we combine a larger enclosure with deeper tuning. Sure enough, the graph above supports this. The 2.68-cubic-foot enclosure tuned to 30 Hz would rumble! Driver excursion limits are very similar to the previous simulations.

Now, can we go too far with variances in enclosure volumes? What if someone doesn’t understand balancing speaker protection with frequency response and constructs a massive enclosure with a very low tuning frequency? Let’s look at that.

Oversize Subwoofer Enclosure
Our reference 1.79-cubic-foot vented enclosure in yellow and the same driver in 6 cubic feet tuned to 17 Hz.
Oversize Subwoofer Enclosure
A cone excursion comparison between a 1.79- and a 6-cubic-foot vented enclosure.

The massive 6-cubic-foot enclosure shown above is tuned to 17 Hz and has an F3 frequency of 24.5 Hz. On paper, this looks like a great home theater subwoofer enclosure. However, looking at the excursion graph shows us we have a problem. At 26.5 Hz, the massive enclosure isn’t controlling cone excursion. We are within a millimeter of the driver exceeding its limits. Remember from our subwoofer quality comparisons that distortion increases with excursion. So this solution likely won’t sound all that great, even if it produces lots of output at low frequencies.

Lesser subwoofers used in moderately large enclosures often encounter excursion issues above the tuning frequency. This is common with drivers with very compliant suspensions.

Proper Enclosure Modelling is Crucial

We see people on the internet “designing” subwoofer enclosures with free software daily. We love that enthusiasts want to experiment and build their audio systems. However, the instructions for the software don’t include knowing how to interpret the data these software packages deliver. You’ll find many expert mobile enhancement retailers who know how to combine enclosure designs with digital signal processing and the natural transfer function of a vehicle to deliver impressively compact and efficient subwoofer enclosure solutions that sound phenomenal and operate reliably.

So what happens when you put a subwoofer in an oversized subwoofer enclosure? Well, you might get more deep bass. You might get more controlled bass. You might run into excursion-based power handling issues and damage the driver. Thankfully, subwoofers from top-tier brands like Rockford Fosgate have a balance of suspension design and excursion capability, making them very flexible and resistant to enclosure design and construction errors. If you want the bass in your vehicle to sound the best it can, drop by a local specialty mobile enhancement retailer and have them design a custom enclosure that maximizes the available space in your vehicle and ensures that the subwoofers you’ve chosen will work well with your amplifier.

This article is written and produced by the team at www.BestCarAudio.com. Reproduction or use of any kind is prohibited without the express written permission of 1sixty8 media.

Filed Under: ARTICLES, Car Audio, RESOURCE LIBRARY

Subwoofer Enclosure Terminals Cups and Connections

Terminal Cup

One thing common to every car audio subwoofer enclosure is that they need to connect to the subwoofer amplifier. Most subwoofer enclosures include a terminal cup or something similar to facilitate easy connection to the subwoofers. Let’s look at subwoofer enclosure speaker wire connection options.

Guess What? Ohm’s Law

If you’re serious about car audio, Ohm’s law should be tattooed on your body – or at least, you should understand it explicitly. Almost every electrical connection requires some consideration of voltage, current and resistance. Regarding subwoofer enclosure terminals, we’ve seen many discussions where the primary consideration was power. In reality, power isn’t the issue – current is.

Let’s say you have an 800-watt amplifier powering your subwoofer enclosure. If the subwoofers in the enclosure have a net nominal impedance of 4 ohms, the amplifier must flow 14.14 amps through the wires to the enclosure. In terms of appropriately sized wiring, if your installation uses 5 feet of 16 AWG wire, you’d waste 1% of the energy from the amp as losses in the wire itself. Eight watts isn’t much and isn’t anything to worry about. Jump to 12 AWG, and the losses are only 3.4 watts. It’s still not something you’re going to lose sleep over.

These days, most car audio amplifier manufacturers offer subwoofer amplifiers designed to produce power into lower impedance loads. Let’s say your amplifier delivers 800 watts into a 2-ohm load. The amp must provide 20 amps of current to make the same power. Losses in the wiring still aren’t a huge issue. Five feet of all-copper, full-sized 16 AWG wire would convert 17 of the 800 watts into heat. Jumping to 12 AWG drops that to 6.8 watts. Still not a mess.

Let’s say your subwoofer enclosure has a nominal impedance of 1 ohm, and your chosen amp can deliver 800 watts into this impedance. We are now talking about 28 amps of current flowing through the speaker wire. That 5-foot run of 16 AWG wire would waste 34.4 watts of energy. The issue is that the power is wasted as heat. Dissipating almost 35 watts of heat is challenging, and the wire will get warm. When conductors increase in temperature, their resistance increases. That’s a whole other can of worms! If your installer uses 12 AWG wire to connect your amp to your subwoofers, the losses are down around 13.6 watts – which is pretty safe.

A quick side note about low-impedance subwoofer loads: All but two or three of the hundreds of amplifiers I’ve tested increase the distortion they add to an audio signal when driving lower impedance loads. Every amplifier I’ve tested presents a significant reduction in amplifier efficiency caused by running subwoofers at lower impedances. If you care about sound quality in any way, you’ll find a nice two-channel amp and bridge it to run your subwoofers at a 4-ohm load.

Here’s a quick chart to show how much current is required to feed subwoofers with different power levels of amplifiers and 4-, 2-and 1-ohm loads.

Terminal Cup

Any time current flows through a connection, there is going to be some amount of resistance. When current flows through a resistor, be it resistance in a connection or an actual resistor component, heat is generated. The formula to calculate the power wasted in a resistor is P = R x I x I. As the current in the equation is squared (I x I), small increases in current flow result in significant increases in the amount of wasted power and heat created.

Subwoofer Enclosure Terminal Cups and Connections

If you visit a local specialty mobile enhancement retailer and look at the prefabricated subwoofer enclosures they offer, you’ll see a variety of terminal cup solutions. Some use large binding posts that accept bare wire up to 10 or even 8 AWG. Others use small spring-loaded terminals that might accept 14 AWG wire.

The first terminal we’ll look at is the basic spring-loaded terminal type. This terminal type will be the least ideal for conducting surface area between the speaker wire from your amplifier and the connections inside the amplifier. All the current has to pass through a thin piece of stamped steel. We see people sharing images of these terminals melting all the time.

Terminal Cup
An example of an inexpensive spring-loaded subwoofer terminal cup.

The next step up in terminal cup quality is also spring-loaded but has significantly more surface area. These terminals pass the current through a stud rather than a piece of stamped steel.

A common drawback with this type of connection is that some are designed so the clamping portion doesn’t squeeze small-gauge wire well. If the speaker wire is flopping around loose, things will get hot when you pour on the power. If the springs have enough pressure, the right size wire is used and the wire is inserted properly, these should work better than the previous option.

Terminal Cup
An example of a good-quality spring-loaded terminal cup.

The last terminal cups we’ll look at are called binding posts. These are similar to the previous cup in that the wire is inserted into a hole in the center stud. A nut threads down to secure the connection rather than a spring applying pressure to the wire.

The number one issue is whether or not the nuts are tightened correctly and if they stay tight. If anything were to loosen over time, you’d end up with a high-resistance connection, which will produce significant amounts of heat.

Terminal Cup
An example of an all-metal binding-post style terminal cup.
Terminal Cup
Another popular type of binding-post terminal cup uses plastic nuts with threaded inserts.

If your car audio system uses binding posts, it’s worth checking them frequently to make sure they’re tight.

Testing Subwoofer Terminal Cups

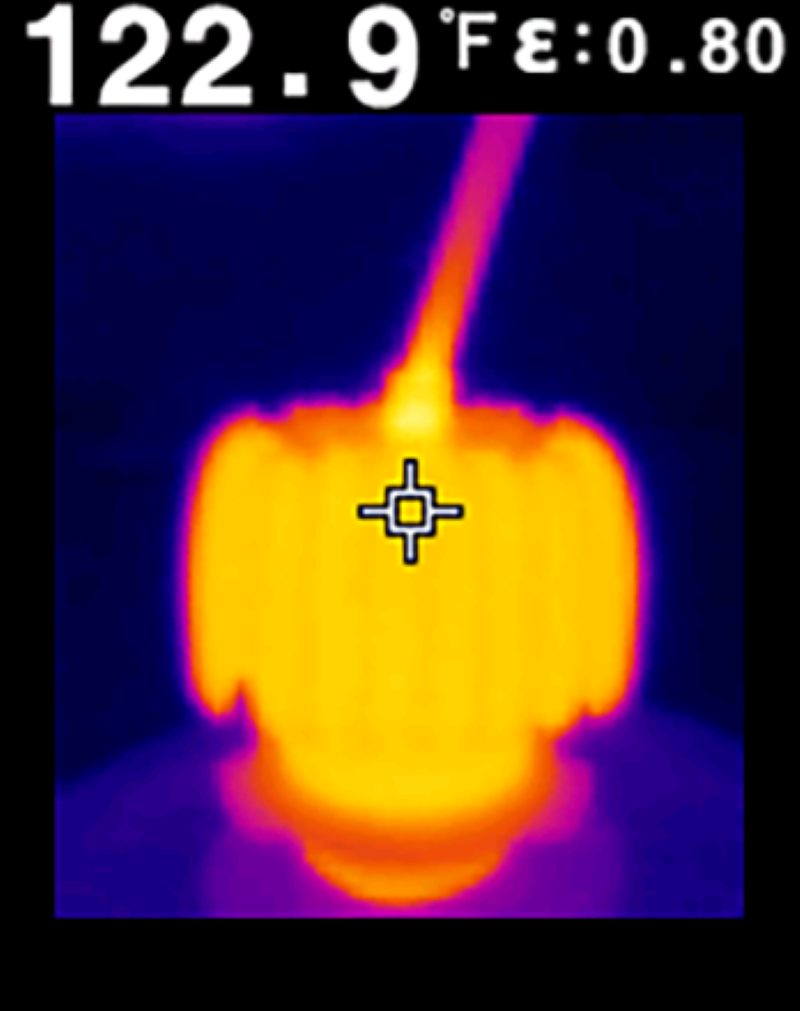
So, just how much current can a terminal cup handle? As you can imagine, this is an excellent idea for some testing. We rounded up a few cups and connected them to the power wire on an amplifier. With a shunt resistor in series, we can accurately measure current flow. We wired the terminal cups up one at a time and slowly increased the current flow until they produced significant amounts of heat. We’ll give them an approximate current rating based on being able to handle two minutes at a specific current level. You can use the chart above to determine the amount of power the cup can handle based on the impedance of your subwoofers.

Up first was the inexpensive spring-loaded cup. We started with 5 amps of current. Not much exciting happened, and the connection generated no heat. Things stayed pretty steady as we increased current. The voltage drop also increased reasonably steadily. By 15 amps of current, the connection to the wire was producing 100 degrees F of heat. Fifteen amps equals 225 watts with the subwoofers wired to a 1-ohm load. Things started to go south at 23 amps of current, or just over 500 watts when wired to 1-ohm. The connection increased in temperature faster. At 24 amps, I could smell something, and the connection was over 180 degrees. At 25 amps, the plastic spring block started to smoke, and the connector melted. The wire is now permanently attached to the cup.

Terminal Cup
If you were wondering, these plastic blocks melt and produce smoke around 200 degrees F.
Terminal Cup
The terminal block started to melt at about 24 amps of current.
Terminal Cup
The metal tab on the positive terminal has moved about 1/16 inch because the plastic melted.

The other terminal cup I had here in the lab was a threaded binding-post style. I hypothesized that the added surface area of the center post, combined with the nut on the back securing the tab in place, would help provide less resistance and, thus, more current carrying capacity.

Once again, things seemed fine with current levels up to about 6 amps, with no measurable heat at the connection. Six amps equals 36 watts of power to a 1-ohm load. As with the inexpensive spring-loaded block, resistance increased as the current flow increased. The connection reached 100.5 degrees with 18 amps of current, which is only slightly better than the first terminal. However, this is nowhere near the performance I expected. At 28 amps of current, or 784 watts into a 1-ohm load, the entire metal assembly had melted the plastic, and the terminal started drooping.

Terminal Cup
The binding post terminal cup reached about 200 degrees with 28 amps of current.
Terminal Cup
The front of the melted binding post terminal cup.
Terminal Cup
The back of the melted binding post terminal cup.

Let’s do some quick math on my measurements during the testing. First, I measured the voltage drop from the wire connected to the terminal (just beside the connector) to the terminal strip on the back of each terminal cup. The graph below shows the blue spring-loaded cup and the orange binding post.

Terminal Cup
Voltage drop across the two tested terminal cups.

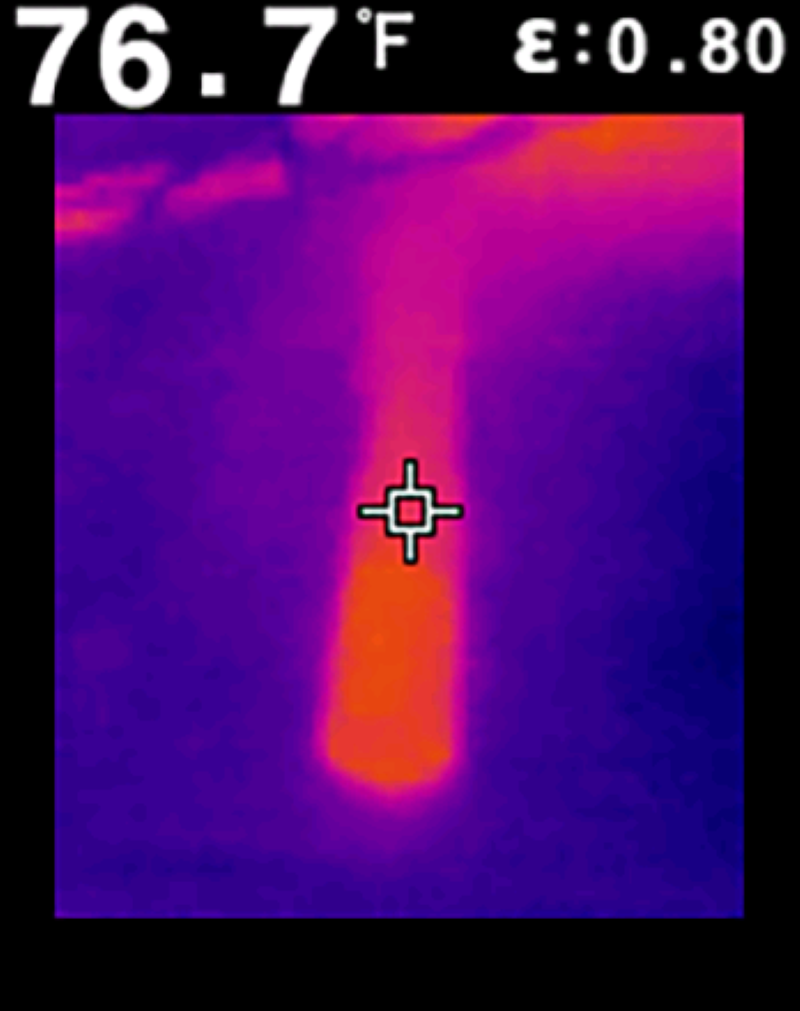
I used my thermal imaging camera to measure the temperature of each connection at each current level.

Terminal Cup
Terminal cup temperature and different current draw levels.

If we want to extrapolate some current handling limits from the day, the spring-loaded cup is good for about 22 amps of current, and the binding post cup can handle about 25 amps. These are, of course, continuous current numbers. These correlate to 484 watts at 1 ohm, 968 watts at 2 ohms and 1,936 watts at 4 ohms for the spring-loaded cup. The binding post can theoretically handle 625 watts at 1 ohm, 1,250 at 2 ohms, and 2,500 at 4 ohms.

There are a few caveats to this test. These are continuous current measurements. If you’re listening to very dynamic music, you can likely use more power. However, things don’t take long to melt at the upper limits, so be cautious in choosing your subwoofer enclosure.

Another caveat is that we used 14 AWG all-copper wire. You may experience different performance levels with larger or smaller conductors.

The Best Way to Connect to a Subwoofer Enclosure

Doing this quick test also gave us the idea to test a few quick-connect styles as suitable solutions for delivering significant amounts of power to a subwoofer enclosure. You’ll have to watch for that article soon. In the meantime, we suggest choosing an enclosure that uses multiple terminals if you’re attempting to deliver significant power at low impedances. Your local specialty mobile enhancement retailer can then run multiple speaker wires back to the amplifier to improve efficiency and provide an audio system that is as reliable as possible. Better yet, forego any connector and ask them to run the speaker wires directly from the amp to the subwoofers and seal the wire where it enters the enclosure.

This article is written and produced by the team at www.BestCarAudio.com. Reproduction or use of any kind is prohibited without the express written permission of 1sixty8 media.

Filed Under: ARTICLES, Car Audio, RESOURCE LIBRARY

What Is GPS Locating and How Does it Work?

GPS Locating

Undoubtedly, you’ve heard the term GPS. It’s not uncommon for consumers to refer to navigation software like Waze, Google Maps, Apple Maps or a portable navigation device from Garmin or TomTom as a GPS. Unfortunately, giving these solutions the GPS title is incorrect. Let’s look at GPS, how it works, and how similar technologies are evolving.

What Is GPS?

The Global Positioning System (GPS) is one type of global navigation satellite system (GNSS). A GNSS uses an array (also called a constellation) of satellites that broadcast extremely accurate time signals. A receiver on the ground (or in your vehicle, a portable navigation device or a smartphone) receives several of these signals. Based on the information from multiple satellites, the receiver can calculate its location and altitude.

GPS was a project started in the early 1970s by the U.S. Department of Defense to provide accurate location information to military troops and was initially called Navstar GPS. Previous terrestrial locating systems such as Decca, LORAN and Omega used longwave radio transmissions from ground-based antennae. A receiver would capture a master signal, then signals from slave transmitters. Analyzing the time differences between the signals allowed for location calculation.

GPS uses a satellite constellation that circles the globe in medium Earth orbits about 20,000 kilometers above the ground. The first satellite was launched in 1978, and the full constellation was completed in 1993. There are currently 32 operational satellites, and the United States Space Force operates the system.

How Does GPS Locating Work?

Each GPS satellite orbits the Earth once every 11 hours, 58 minutes and 2 seconds. Each satellite continuously transmits a signal containing the satellite’s orbit details and precise time information from an onboard atomic clock. The receiver can calculate the distance to the satellite by comparing the time that the signal left the satellite to when it arrived at the antenna. Once the receiver has distance information from several satellites, it can attempt to pinpoint a location using a process called trilateration.

GPS Locating
The red circle on the Earth’s surface represents possible locations equidistant from the satellite.

In the image above, we see a circle on the Earth. This circle represents all the possible locations where the distance between the ground and the satellite is equal. Let’s say the satellite is 26,000 kilometers away from this location. It would take 0.0867266647515195 second for the signal from the satellite to reach any place on this red circle. This information alone doesn’t tell us much about the location, other than perhaps what part of the planet we are on. We likely already know that. Let’s add another satellite.

GPS Locating
The yellow and red circles represent possible locations equidistant from their respective satellites.

We’ve added information from a second satellite, shown by the yellow circle. This satellite appears to be a bit farther away from our location at 29,000 kilometers. It would take the signal from the satellite 0.0967335876074641 second to travel that distance.

Whatever GNSS receiver we are using can analyze the data from the satellite and determine that we are 26,000 kilometers from one source and 29,000 kilometers from the other. This information gives us two possible locations on the Earth’s surface. The small green dots in the image above mark these locations. We are close to having our position, but we need more data. One more satellite is required.

GPS Locating
The yellow, red and violet circles represent possible locations equidistant from their respective satellites.

We’ve added a third circle. This satellite might be 22,000 kilometers away. As such, we know the time it takes for the data to arrive at our receiver should be 0.0733841009435934 second. Only one location on the Earth has these three signal travel times to their respective satellites. The blue dot represents that location.

Satellite-Based Positioning System Accuracy

Unfortunately, the clock on our GPS receiver is nowhere near as accurate as the atomic clocks on the $250 million satellites. This reduction in timing accuracy decreases the location accuracy as we have to throw away some of those decimal places from the timing calculations. Some quick math shows us that limiting the timing accuracy to eight decimal places reduces the accuracy to an area of over 2 meters when the satellite is far away and about 30 centimeters when the satellite is close.

Other issues like atmospheric effects can cause timing errors. Part of the cost of operating GPS is constantly checking and calibrating each satellite’s signals. High-precision receivers at fixed locations on the ground continuously monitor the signals from all the orbiting satellites. Measurement of errors because of humidity, atmospheric pressure and ionospheric delay can reduce accuracy to dozens of kilometers. The operators use data from fixed ground stations to create compensation signals transmitted back to the satellites to counteract these and many other errors.

In real-world applications, GNSS systems require data from at least four satellites, as this allows for some error correction. Consumer-level GPS receivers typically have a published accuracy of about 30 centimeters or 1 foot. The latest high-precision receivers can provide locations with an accuracy of 8 mm in longitude and latitude and 15 millimeters in altitude.

If you’ve seen a YouTube video of a 3D drone show, they use GNSS modules that provide location accuracy with real-time precision of about 1 inch.

Below, a fleet of 200 Lumenier Arora light show drones doing testing at the Freedom Factory in Florida.

Are There Alternatives to GPS Locating?

While everyone talks about GPS locating as the de facto standard in GNSS systems, the reality is that many similar systems are in operation around the world. Aside from the U.S.-operated GPS, the Russian Federation operates GLONASS, China has the BeiDou system, and the European Union has Galileo. There are also regional systems like India’s NavIC and Japan’s QZSS. As of this article’s writing, there are 136 GNSS satellites in operation around the Earth, with 15 more as backups or in various commissioning stages.

The highest precision receivers, like those used for military and surveying, can simultaneously receive location data from multiple systems to increase accuracy. Many solutions, like Galileo, offer precision down to 1 centimeter or 0.39 inch with access to encoded data.

How Do We Use GNSS Services?

Navigation systems are among North America’s most popular consumer applications for GNSS information. Whether you have a portable navigation device (PND) like a Garmin or TomTom or rely on a smartphone-integration solution like Google Maps, Apple Maps or Waze, these systems pinpoint your location on a map database using a combination of GPS and location calculation using a system called Assisted GNSS. If you’ve ever put an iPhone into airplane mode, you may have seen a message about location services being more accurate when connected to a cellular service. Assisted GNSS downloads position data from a server over the cellular data network. In short, this technology knows which cellular towers you are close to and can use that information to help triangulate your location. Data about which GNSS satellites are in (relatively) close proximity is also downloaded to speed up the acquisition time of the GNSS receiver.

GPS Locating
Navigation software like Google Maps is a popular application for GNSS information.

Of course, tracking and locating systems like the popular DroneMobile solution from Firstech combine a GNSS receiver with a cellular data radio. You can control a Compustar remote car starter or security system from the DroneMobile app on your smartphone. If you’ve signed up for location-based services, you can pinpoint the position of your vehicle or configure location-based alerts to help you monitor your car or truck.

GPS Locating

GPS location information and tracking are great for hikers who want to venture into the woods and still find their way back home. Devices like SPOT satellite communication devices use GNSS information with Globalstar satellite messaging services to provide emergency support services almost anywhere on the planet.

GPS Locating
The SPOT brand of communication and tracking devices is popular with adventurers.

There are dozens of commercial applications for GNSS data. Construction of large buildings often starts with surveying. Precision survey equipment uses GNSS data to mark property boundaries and denote parking lot elevations for proper drainage. The corners of building footings are also crucial identifiers based on GNSS data. If you’ve ever wondered how bridges are constructed simultaneously from opposing sides of a river to meet perfectly in the middle, it is attributable to accurate GNSS data. Modern construction equipment also uses GNSS data to provide exact elevation information.

GPS Locating
Companies like Bench Mark in Calgary, Alberta, utilize precision GNSS survey equipment to provide accurate information to clients.
GPS Locating
Some Volvo excavators include Dig Assist, a GNSS-based set of tools to help operators visualize the end product.

Almost every commercial vehicle has location tracking — from airplanes and ships to trains, buses and transport trucks. Companies must keep track of their assets and ensure that they are safe and comply with company usage guidelines. GNSS information can help global operations avoid weather concerns.

GPS Locating
A view of the ships crossing the Atlantic Ocean from MarineTraffic.com.
GPS Locating
Comparing the shipping routes to the weather on the same day shows vessels avoiding hurricanes Lee and Margot.
GPS Locating
In case you were wondering, the Ever Given, the famous ship that blocked the Suez Canal, is back in operation.
GPS Locating
The location and heading of airplanes from all over the globe are available on Flightradar24.com, thanks to GNSS information.

The Future of GNSS Information

So what does the future hold for location information services like GPS, GLONASS and BeiDou? Companies like ALPS Alpine are working on location-based sensors for vehicles as part of the vehicle-to-everything (V2X) push. These products will dramatically improve autonomous driving technologies and help develop intelligent AI-based accident prevention as vehicles can communicate with one another with impressive location precision.

For now, when someone tells you to use GPS to get directions, they are referring to a navigation device that uses some or many forms of GNSS, including GPS locating. If you want to integrate the latest navigation technologies into your vehicle, drop by a local specialty mobile enhancement retailer and ask about a new radio or smartphone integration solution with Apple CarPlay and Android Auto.

This article is written and produced by the team at www.BestCarAudio.com. Reproduction or use of any kind is prohibited without the express written permission of 1sixty8 media.

Filed Under: ARTICLES, Navigation, RESOURCE LIBRARY

  • « Previous Page
  • 1
  • 2
  • 3
  • 4
  • 5
  • 6
  • …
  • 103
  • Next Page »

Recent Articles

The back of a car audio subwoofer on one side and a man with a perplexed thinking face looking at it on the other side

Car Audio Myths: DVC Subwoofers Can Handle More Power

May 11, 2025 

We’re back to bust another car audio myth wide open. This article will discuss the myth that DVC subwoofers can handle more power than a single voice coil driver. After some … [Read More...]

Various car audio amplifiers, speakers, and equipment

Car Audio Myth: You Can’t Hear Low-Frequency Distortion

May 4, 2025 

At least once a week, someone comments on social media or in a forum that you can’t hear low-frequency distortion from subwoofers or amplifiers. We have no idea where this myth … [Read More...]

Compustar EZGO II

Product Spotlight: Compustar EZGO-II

April 28, 2025 

Hands-free proximity unlocking is a feature found on many new cars and trucks fresh off the showroom floor. The Compustar EZGO-II adds this convenience to your remote car starter … [Read More...]

a black car in the snow with its headlight on and a hand holding a stopwatch off to the side

What’s the Ideal Car Warm-Up Time with a Remote Starter?

April 27, 2025 

Never in a million years did we think that the internet would debate the appropriate amount of time that’s ideal for a remote starter to warm up a car. Some folks believe that even … [Read More...]

color patterns

Fine-Tuning Your Sound: Understanding the Power of Parametric Equalizers

April 20, 2025 

When looking at the options for frequency response correction for audio systems, your installer has two choices: graphic or parametric equalizers. Both types of equalizers perform … [Read More...]

Customer Reviews

Subscribe to Our Website

Enter your email address to subscribe to our website and receive notifications of new posts by email.

Quakertown Showroom and Installation Facility


Get Directions to Clear Vibrations

Hours

Monday9:00 AM - 5:00 PM
Tuesday9:00 AM - 5:00 PM
Wednesday9:00 AM - 5:00 PM
Thursday9:00 AM - 5:00 PM
Friday9:00 AM - 5:00 PM
SaturdayClosed
SundayClosed

Services

  • Car Audio
  • Custom Installation
  • Fleet Services
  • Driver Safety
  • Remote Car Starters

Connect With Us

  • Facebook
  • Instagram
  • Twitter
  • YouTube

Copyright © 2025 Clear Vibrations · Privacy Policy · Website by 1sixty8 media, inc. · Log in


Loading Comments...