
When it comes to upgrading your vehicle’s lighting, a clear understanding of lumens, lux and candela is not just beneficial, it’s crucial. Just like some less scrupulous car audio amplifier, speaker and subwoofer manufacturers, automotive lighting manufacturers often manipulate specifications. This is evident when you browse through platforms like Amazon, AliExpress or Temu, where you’ll find automotive headlight bulbs and flashlights with exaggerated output specifications. At BestCarAudio.com, we take specifications and measurements seriously. So let’s dive into the difference between lumens and lux, and debunk a few examples of overrated products, empowering you to make informed decisions when upgrading your vehicle’s lighting.
Definition: Lumens
Let’s shed some light on lumens. A lumen is not just a unit of measurement; it’s the key to understanding the brightness of visible light emitted from a light source. In simpler terms, it’s the measure of how bright a light source is. This knowledge is particularly valuable when you’re considering a lighting upgrade for your vehicle.
This will get a bit complicated, but the information is necessary. A steradian, also known as a square radian, is a unit that describes the area of a sphere. A sphere is divided into 4pi or 12.56636 steradians. A single steradian is defined by the area on the sphere’s surface that represents the square of the sphere’s radius. For example, if the sphere has a diameter of 6 feet and subsequently a radius of 3 feet, then 1 steradian would have an area of 9 square feet. The area would be 25 square feet if the radius were 5 feet.

Now, why does a steradian matter to the definition of a lumen? It’s because 1 lumen is defined as the amount of light produced by a light source of 1 candela over an area of 1 steradian (sr). As a gross generalization, 1 candela is the amount of light produced by a (very specifically defined) candle. Annoyingly, the definition of a candela describes a light source that produces 1 lumen of luminance over an area of 1 steradian. This might seem like circular logic, but understanding these terms can help you make informed decisions when buying automotive lighting products.
Imagine we have a portion of a sphere, which would be like an umbrella. The area of the underside of the umbrella is the square of the length of the handle (assuming the entire surface of the umbrella is equidistant from the base of the handle). If we illuminate it with a light source of 1 candela (located at the base of the umbrella), then we would see 1 lux of illumination on the underside of the umbrella.
Definition: Lux and Candela
Now, a lux (lx) defines luminance and describes the perceived intensity of light. One lux is the brightness level of 1 lumen over 1 square meter. We use the term lux to describe brightness levels. For example, if you are trying to photograph or shoot a video of something, you will need to ensure that there’s enough light to get proper exposure. Handheld light meters are used at photoshoots and movie sets to ensure consistent lighting.
Now, our light meter measures illuminance using the unit candela. This is directly related to lux in that 1 candela is 1 lumen over an area of 1 steradian, just as we mentioned in the umbrella example.
We must consider the area of adequate illumination in any light measurement. Why? Think of what happened during the solar eclipse in April. The sun’s light output didn’t change, but because the moon blocked the light, we experienced darkness. The sun is said to produce 36 octillion lumens of output, or 3.6 x 1028. That’s pretty bright. However, it sure got dark here on April 8. We went from 3,000-5,000 lux (as it was partly cloudy) to probably about 5 lux. In retrospect, we should have measured it and logged the data.
In the context of light sources, we use the term lumen to describe the amount of light produced at the source, and lux or candela to describe the intensity of the light at a specific point. Nobody should care how bright the lightbulb is if it can’t light up what we want to see.
Light Source Measurements – Automotive LED Bulb
Let’s look at two light source examples that will help illustrate why understanding lighting specifications is essential. We’ll start with a low-cost LED replacement headlight bulb. We found a bulb from a company called Hocolo on Amazon. The listing claims that the bulb consumes 25 watts of power, produces 4,000 lumens of light and has a color temperature of 6,500K. You have to read the fine print to see that the large 8,000-lumen claim in the listing title is for a pair of bulbs and that the published 50-watt rating is also per set. Silly. That’s like car audio companies that provide a wattage rating for a pair of speakers.
We have several solutions for measuring the power a device consumes, but we’ll keep things simple and pass the current from our bench power supply through the 10-amp input of one of the Fluke meters in our lab. We’ll use a second meter to measure the voltage at the bulb. We measured 13.94 watts into a single bulb after the required 30-second warm-up period. Unlike incandescent bulbs that use wattage ratings to describe their light output, the power rating number is quite useless with LED bulbs, other than to identify that they consume less current than their archaic brethren.
Next, we will measure the total light output of the HID bulb using our new TKLamp Flashlight Tester integration sphere. An integration sphere is a specialized light-measuring device that can quantify the total output of a light source. It features, unsurprisingly, a sphere, which, in the case of the TKLamp, is about 6.25 inches in diameter. The sphere’s interior surface has a special white coating that disperses light evenly in all directions. Finally, a high-accuracy light sensor tells us exactly how many lumens the light produced.


The Hocolo bulb measured 1,424 lumens initially and 1,257 lumens at the 30-second mark. As we’ve tested many bulbs, it’s not uncommon to see those designed to be as bright as possible dramatically reduce their output as they heat up. Pushing an LED harder, which means pushing more current through it, does make it brighter, but it also dramatically reduces its expected lifespan. The Hocolo was down to 1,163 lumens at the two-minute mark and continued to decrease.

Finally, we want to measure how much light this bulb can produce at a distance of 1 meter (3.28 feet) away from the source. The TKLamp system includes a secondary measurement sensor to capture candela. Once again, we let the bulb run for 30 seconds before we took a measurement. In fact, we took two measurements. The first had one side of the bulb where the LEDs were mounted and pointed directly at the light sensor. The second measurement has the LED sets pointing left to right rather than one down at the sensor. This perfectly demonstrates the importance of measuring how much light a bulb can shine on the surface you want to illuminate. This is in contrast to stating how much light the source produces overall. We measured 204 candela with one bank of LEDs pointing at the sensor and 40 candela with the sensor in the dark spot between the LEDs.


Light Source Measurement – LED Flashlight
Next, we have an inexpensive flashlight from Pocketman. The sdt356 flashlight uses two AAA batteries and has a rating of 500 lumens. Once again, we used the TKLamp Flashlight Tester to measure the total light output from the flashlight and how much illumination it provides at 1 meter.
After 30 seconds, the TKLamp tester told us the light was producing 55 lumens. In terms of illumination, we measure 1,144 candela at 1 meter from the sensor. The brightness didn’t change significantly over time.

Compare the two numbers from the different light sources. The LED bulb produced 1,100-1,200 lumens, but without a reflector and projector housing, it could only provide 204 candela of illumination at a distance of 1 meter. On the other hand, the little flashlight only produced 55 lumens of output, but thanks to the reflector around the LED, it provided 1,144 candela of illumination on the light sensor. All the light was focused on a relatively small spot. If the beam angle had been adjustable, it would have provided even more candela.
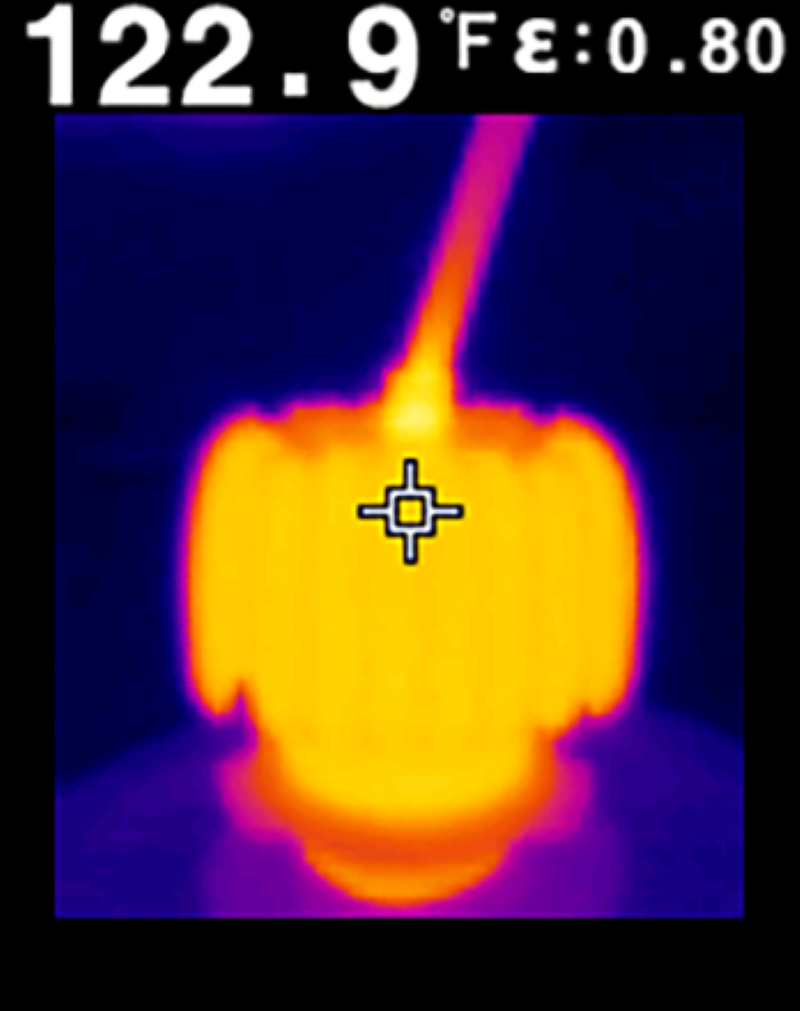
Feel the Heat
As a short aside, we noticed the LED bulb quickly became quite hot. So we broke out the thermal imaging camera to see what was happening. After three or four minutes of operation, the heatsink on the back of the LED had reached almost 123 degrees. That’s pretty toasty. While LEDs are MUCH more efficient than incandescent bulbs, they still produce a lot of heat.
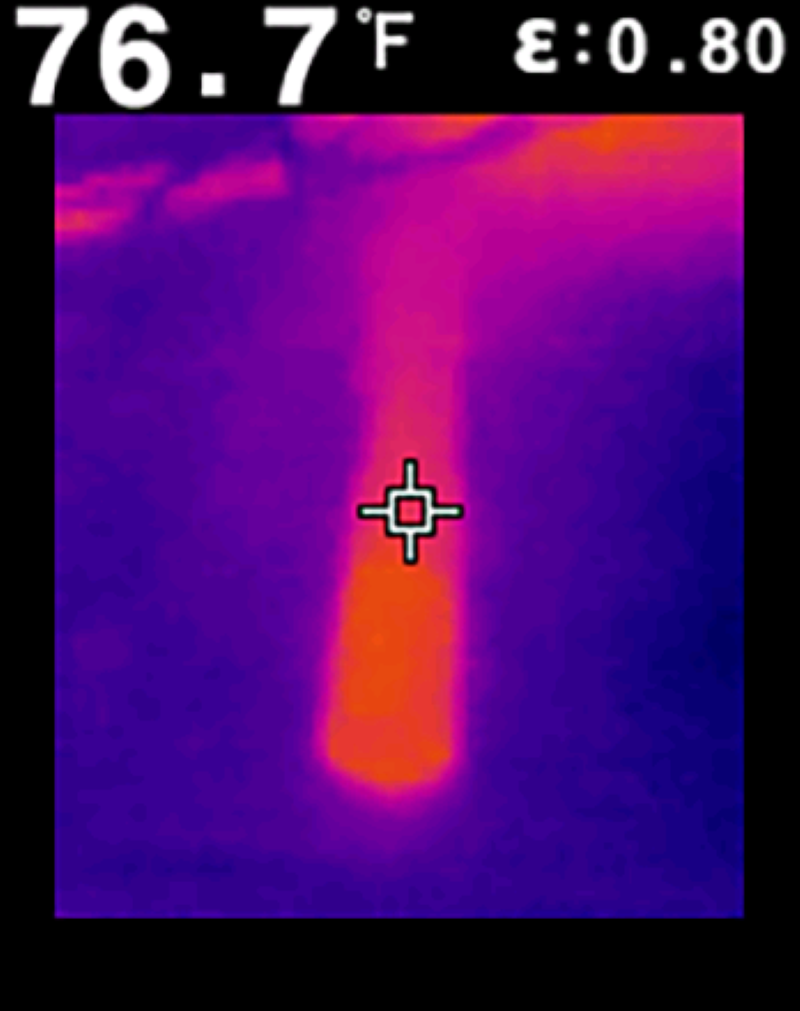
While we had the thermal camera out, we measured how warm the flashlight got. After three or so minutes of operation, the body had reached just under 77 degrees. Not only was this much more comfortable to handle, but the little LED chip in the flashlight would likely last much longer.
Automotive Headlight Upgrades
When it comes to upgrading the lights on your car or truck, please don’t fall prey to thinking that a bulb with a high lumen rating is guaranteed to be brighter or that it will actually produce the light output it claims. The compatibility of the bulb you’ve chosen with the headlight lens assembly on your vehicle plays a massive role in determining how much light will be seen in front of the vehicle. Using a bulb not designed for a specific housing type could result in abysmal performance. If light is produced in directions that might blind oncoming drivers, a theoretically simple upgrade could be extremely dangerous.
If you want to see better while driving in the dark, visit a local specialty mobile enhancement retailer and talk with them about the bulbs they have available and their experience with vehicles similar to yours.
This article is written and produced by the team at www.BestCarAudio.com. Reproduction or use of any kind is prohibited without the express written permission of 1sixty8 media.


